Analysis
Gold Has Given the Signal — Will It Rise This Week?
Sunday, July 12, 2026
Louay Joha — Financial Analyst (Technical & Time-Based Analysis), Economic and Geopolitical Writer
As we prepare for a week packed with important U.S. economic data, including CPI and Core CPI reports on Tuesday, PPI reports on Wednesday, and retail sales alongside unemployment data on Thursday, in addition to a broader series of key economic releases throughout the week, tensions surrounding the agreement between the United States and Iran have intensified. At the same time, continued threats involving the Strait of Hormuz have added another layer of uncertainty, leaving markets exposed to a wide range of possible scenarios and heightened volatility risks.
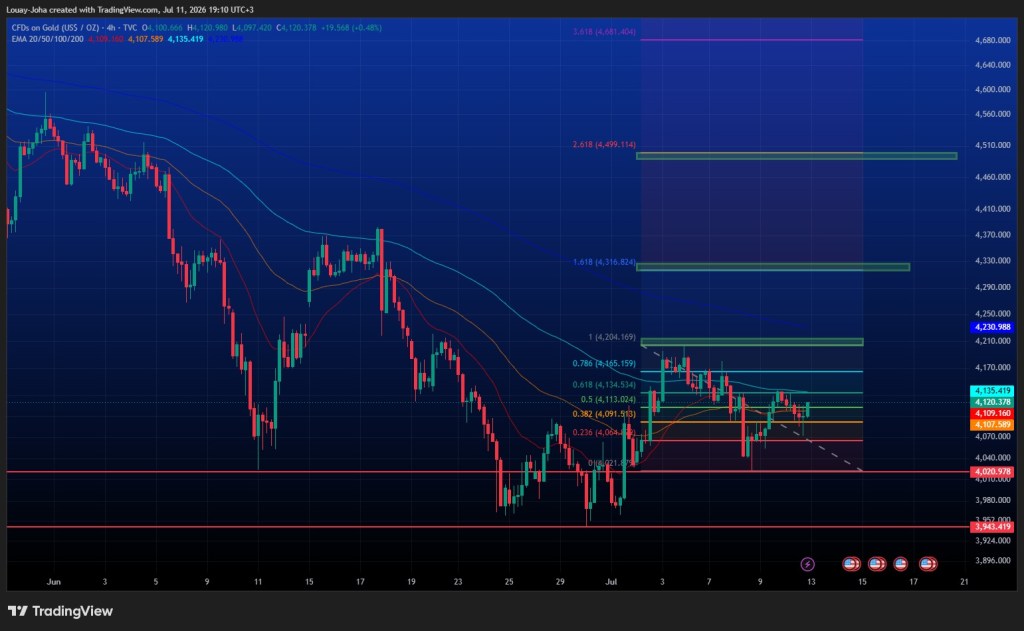
Meanwhile, gold has reclaimed the $4,100 level, and notably, it managed to close above the previous weekly opening level of $4,088, finishing at $4,120.
This is a noteworthy signal, as gold had failed to close above a previous weekly open for six consecutive weeks.
From a technical perspective, the overall picture is still not entirely positive. Gold continues to trade below the 20, 50, 100, and 200 EMAs on the daily time frame. Nevertheless, it managed to achieve a daily close above the 0.382 and 0.5 Fibonacci retracement levels, while also holding above the key psychological support level of $4,000 per ounce.
This could gradually restore buying momentum to the market, particularly if the majority of the upcoming economic data releases favor buyers.
The key technical resistance levels, in order, are:
$4,203 — $4,316 — $4,497 per ounce.
In my view, these levels represent potential upside targets as long as gold holds above $4,100.
However, if gold falls back below $4,100 and records a daily close beneath that level, buying would become considerably riskier. A break below $4,020 could trigger a decline toward $3,940, followed by $3,850 per ounce.
Analysis Summary:
Gold is currently relying heavily on $4,100 as a pivotal support level. Continued trading above this level could keep the bullish scenario intact, with potential targets at $4,203, followed by $4,316, and possibly $4,497. However, gold’s ability to hold above this key level will largely depend on the outcome of upcoming U.S. economic reports and developments on the geopolitical front.
A daily close below $4,100 would weaken the bullish outlook, while a break below $4,020 could open the door to a deeper downward move toward $3,940 and then $3,850 per ounce.
| Gold Falls to Its Lowest Level Since 2025 – What Comes Next?
Sunday, June 28, 2026
Louay Joha – Financial Analyst (Technical & Time-Based Analysis) and Economic & Geopolitical Commentator
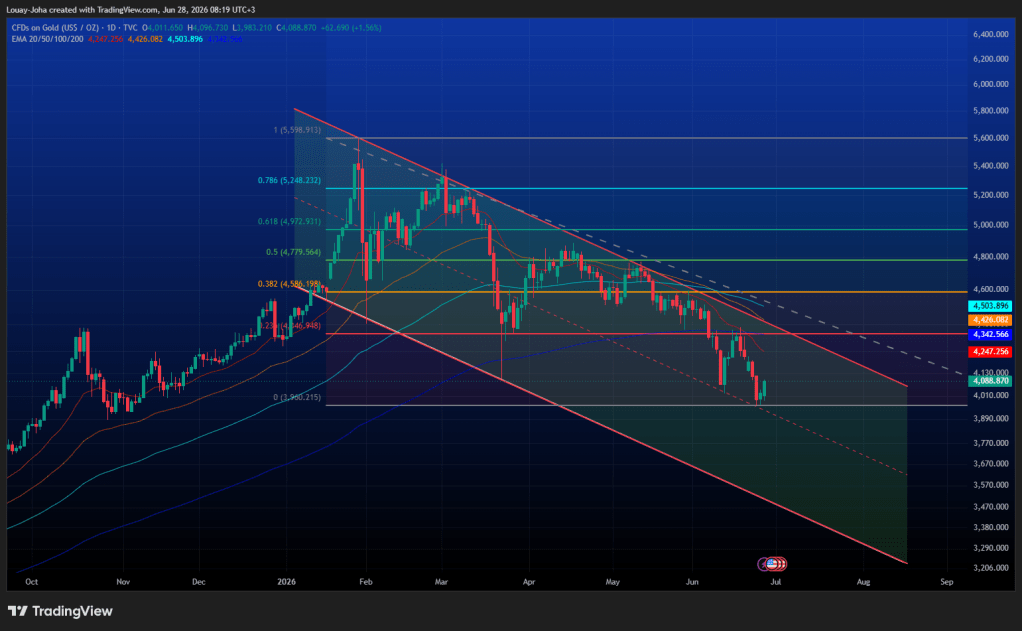
Gold prices declined for the seventh consecutive week, closing at their lowest level of 2026 and their weakest level since 2025, below the $4,100 per ounce mark. This is the same level from which prices staged a strong rebound in March, rallying to $4,892 per ounce after the initial test.
This time, however, gold recorded three consecutive daily closes, in addition to a weekly close below $4,100, signaling noticeably weaker buying momentum compared with the strong recovery seen in March.
From a technical perspective, gold continues to trade below the 50-, 100-, and 200-day Exponential Moving Averages (EMA) on the daily chart. It also remains within a short-term descending price channel. Notably, the recent rebound from $3,959 occurred near the midpoint of that channel, keeping the possibility of a move toward the upper boundary alive. Such a recovery could coincide with the 23.6% Fibonacci retracement level, located around $4,345 per ounce.
This outlook is supported by gold’s ability to remain above the psychologically important $4,000 per ounce level. If prices continue to hold above this support, buyers could gradually return to the market. Therefore, it may be prudent to avoid rushing into new short positions until the current low at $3,958 is decisively broken, as the short-term trend could still shift.
These technical developments come during U.S. Jobs Week, with several key labor market reports scheduled for release. The week begins with the May JOLTS Job Openings Report on Tuesday, followed by the June ADP Employment Change Report on Wednesday. On Thursday, markets will focus on the week’s most important releases, including the Nonfarm Payrolls (NFP) Report, the Unemployment Rate, Average Hourly Earnings, and Initial Jobless Claims.
At the same time, uncertainty continues to surround a potential agreement between the United States and Iran, as well as the future of the Strait of Hormuz. These geopolitical risks leave markets facing a wide range of possible outcomes and increase the likelihood of elevated volatility throughout the week.
Analysis Summary: The broader technical outlook remains bearish. However, gold’s ability to hold above the key psychological support at $4,000 per ounce could provide buyers with an opportunity to stage a short-term corrective rebound. With major U.S. labor market data approaching and geopolitical uncertainty still elevated, the coming week is expected to be highly volatile and could play a decisive role in shaping gold’s next directional move.
Gold Tests Its Most Critical Support Level – Can $4,000 Halt the Decline?
Sunday, June 14, 2026
Louay Joha – Financial Analyst (Technical & Time-Based Analysis), Economic and Geopolitical Writer
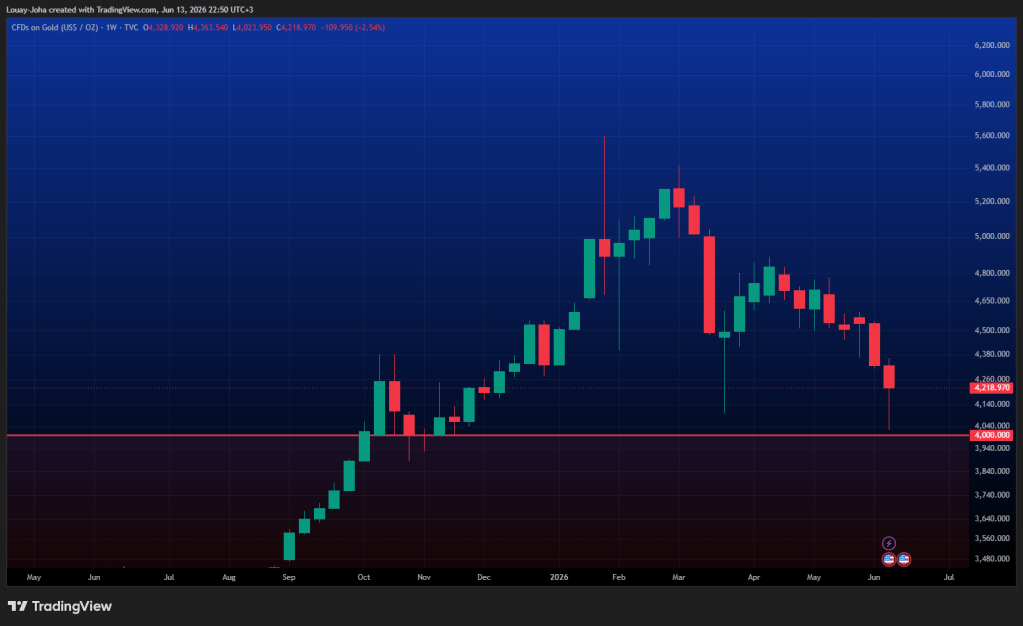
Gold prices have posted sharp losses for the fifth consecutive week, approaching the $4,000-per-ounce level, which currently represents one of the strongest psychological and technical support zones in the medium term. Over the past three weeks, the precious metal has also developed a clearly bearish structure characterized by consecutive lower closes. Each weekly opening has come below the previous week’s opening, while each weekly close has settled below the previous week’s close, without any breakout above the prior week’s high. The same pattern is also evident on the monthly timeframe.
Amid conflicting reports regarding the future of the anticipated agreement between the United States and Iran, as well as expectations surrounding the reopening of the Strait of Hormuz, market attention is turning toward the Federal Reserve this week.
On the economic front, several key inflation indicators were released last week. Monthly Consumer Price Index (CPI) data came in at 0.5%, matching expectations but declining from the previous reading of 0.6%. Core CPI, which excludes food and energy prices, was reported at 0.2%, below both the market forecast of 0.3% and the previous reading of 0.4%.
Meanwhile, the Producer Price Index (PPI) highlighted persistent inflationary pressures at the producer level, rising by 1.1%, in line with expectations and above the prior reading of 0.7%.
These indicators are among the most closely watched metrics used by the Federal Reserve to assess the trajectory of inflation ahead of this Wednesday’s highly anticipated interest rate decision.
From a technical perspective, selling pressure remains firmly in control of the gold market, particularly as daily and weekly closes continue to remain below $4,592 per ounce, which represents the 38.2% Fibonacci retracement level of the rally extending from $4,100 to $4,892.
In addition, price action has failed to establish stability above $4,499 per ounce, the 50% Fibonacci retracement level of the same move, further reinforcing the bearish outlook.
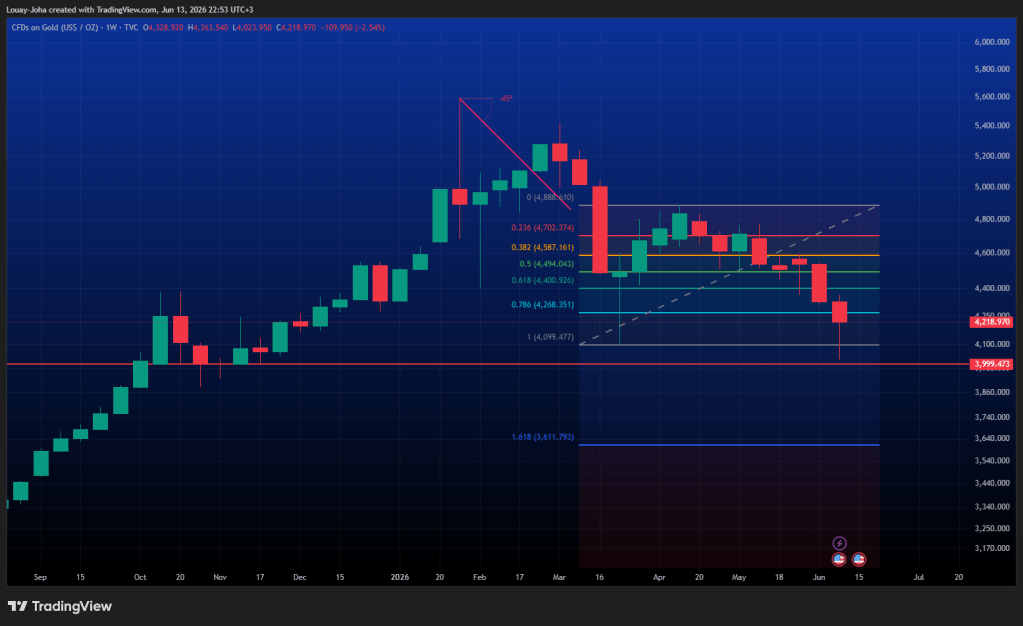
Given the bearish weekly and monthly structure discussed earlier, gold would need to break this pattern before a meaningful recovery can be considered. At a minimum, this would require a weekly close above $4,365 per ounce and a monthly close above $4,555 per ounce. Such developments would provide an initial indication that the current selling pressure is beginning to fade.
Furthermore, the fact that price continues to trade below the EMA 20, 50, 100, and 200 moving averages on the daily timeframe suggests that the rebound seen near the $4,000 level alone is not sufficient to justify a renewed bullish outlook.
From a timing-analysis perspective, price continues to close below the 2/1 angle of the Gann Fan, which also supports the bearish technical picture and points to the possibility of further downside movement.
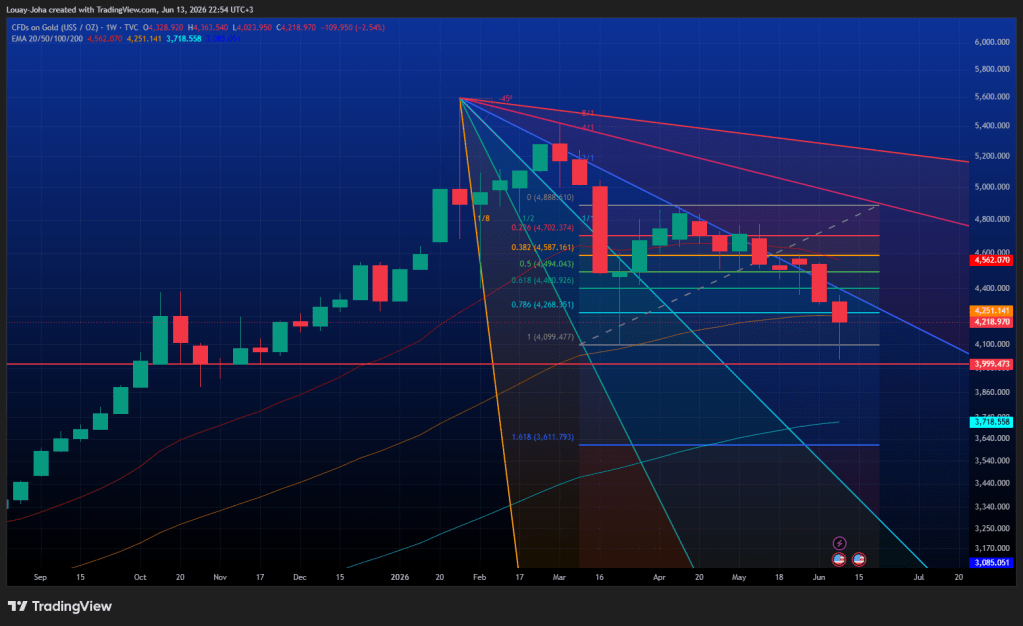
Based on the current evidence, adopting a bullish stance on gold may be premature until clear technical signals emerge that invalidate the negative indicators discussed in this analysis. For now, the $4,000-per-ounce level remains the key dividing line between a continuation of the current downtrend and the beginning of a stabilization phase that could allow gold to rebuild upward momentum.
However, a decisive break below this level followed by a close underneath it could open the door to an extension of selling pressure and a move toward lower price levels in the weeks ahead.
Gold Records Its Lowest Weekly Close of the Year – When Will the Bleeding Stop?
Sunday, June 7, 2026
Louay Joha – Financial Analyst (Technical & Cyclical), Economic and Geopolitical Writer.
On the daily timeframe, gold prices experienced a notable decline, with the yellow metal closing both the daily and weekly sessions below the $4,350 per ounce level for the first time in 2026, following the release of the U.S. labor market data on Friday, including the Non-Farm Payrolls (NFP) report, Average Hourly Earnings, and the Unemployment Rate.
The May Non-Farm Payrolls report showed the creation of 172,000 jobs, down from the previous reading of 179,000, yet significantly better than market expectations of 85,000. Meanwhile, the unemployment rate remained unchanged at 4.3%, in line with forecasts. Average hourly earnings rose by 0.3%, matching expectations and exceeding the previous reading of 0.2%.
Wage growth is generally considered an indicator of rising inflationary pressures, making these figures among the most closely monitored economic indicators by the Federal Reserve ahead of its upcoming interest rate decision.
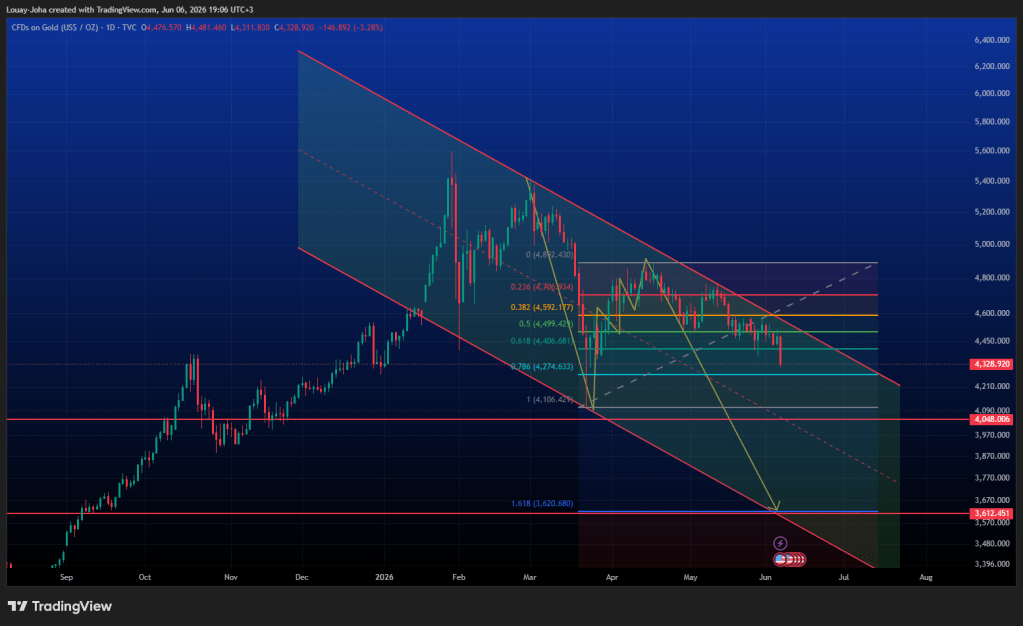
From a technical perspective, selling pressure on gold prices may continue due to daily and weekly closes below the 4,592 level, which represents the 0.382 Fibonacci retracement, as well as below the 4,499 level, corresponding to the 0.50 Fibonacci retracement of the current upward wave extending from the $4,100 low to the most recent peak at $4,892.
These developments coincide with the lowest daily and weekly close of 2026, as noted at the beginning of this analysis. Consequently, buying gold at this stage remains a technically high-risk decision in both the short and medium term. Further declines toward the 4,100–4,050 region remain possible. This area lies near the midpoint of the current price channel and is expected to serve as a critical dynamic support zone.
Should this support area hold, buyer confidence may gradually return. However, a decisive break below it could open the door for additional downside toward the 3,800–3,600 region, particularly if the current geopolitical crisis in the Middle East persists and the Strait of Hormuz remains closed.
Statements by U.S. President Donald Trump regarding the reopening of the Strait of Hormuz no longer appear to have the same influence on financial markets as they did at the beginning of the crisis. Today, global markets require an actual reopening of the strait and a genuine restoration of shipping and energy transportation flows, rather than further political statements.
As time passes, these remarks continue to lose their ability to influence market sentiment, suggesting that the global economy may be approaching a more critical phase regarding the impact of potential energy supply shortages.
Gold May Fall — Clear Warning Signals Ahead
Sunday, May 31, 2026
Louay Joha – Financial Analyst (Technical & Time-Based Analysis), Economic and Geopolitical Writer.
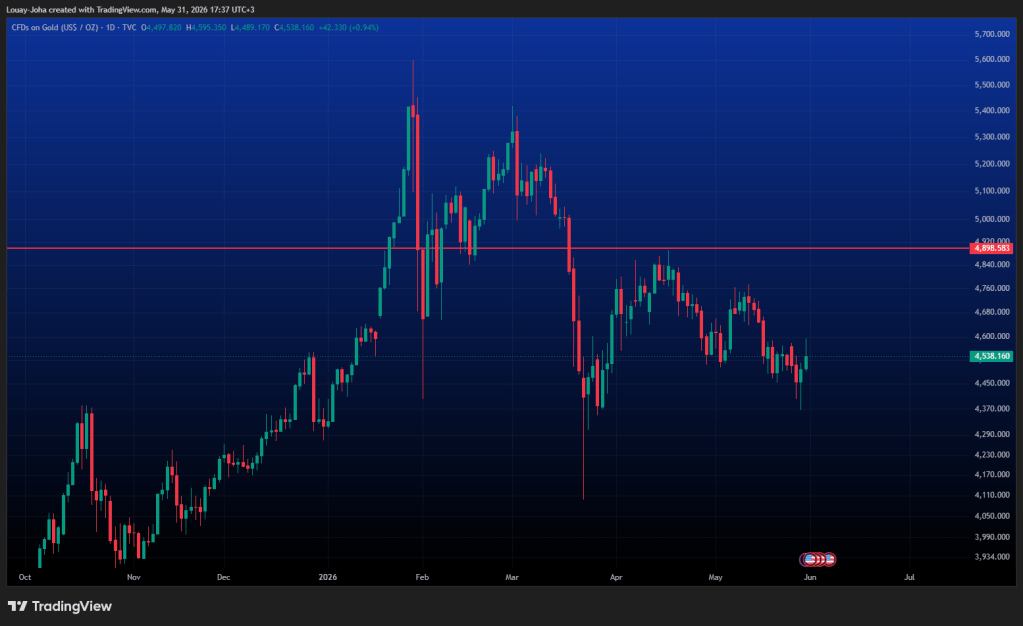
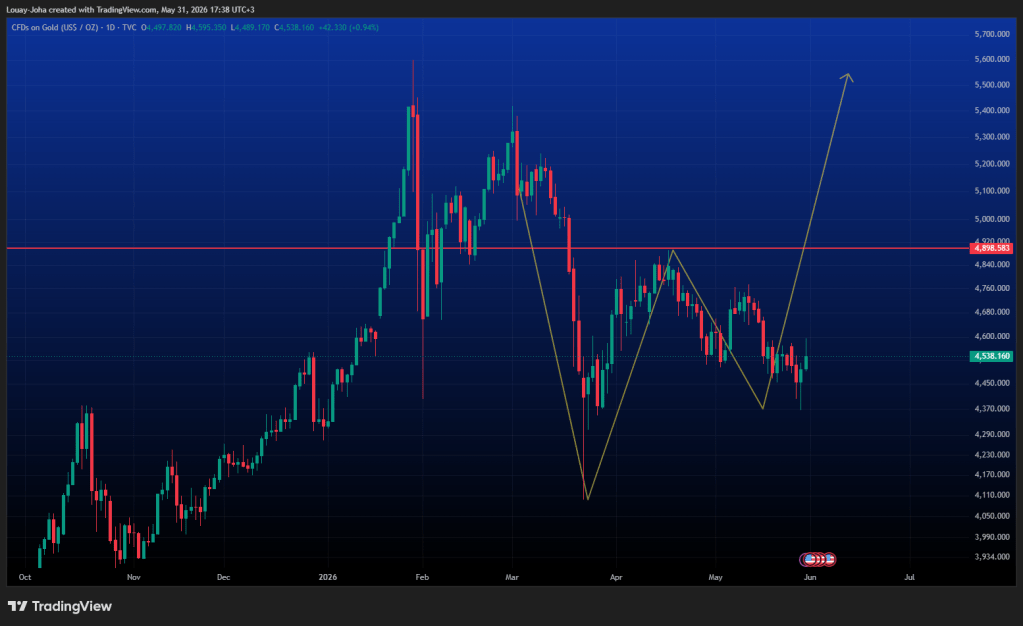
On the daily timeframe, gold had been forming the characteristics of a typical bullish chart pattern. After establishing a major bottom at $4,098, the price rebounded to $4,894. It was therefore logical to expect a pullback to form a secondary bottom before another upward move. A renewed break above $4,894 would complete a classic double-bottom formation.
To confirm the presence of bullish momentum, we apply the Fibonacci retracement tool from the neckline at $4,894 to the assumed recent bottom at $4,363. We find that the key 0.382 Fibonacci level acts as a crucial threshold.
For positive momentum to be considered intact, the price must close above this level on a daily, weekly, and monthly basis. The higher the timeframe of the close, the stronger the bullish momentum.
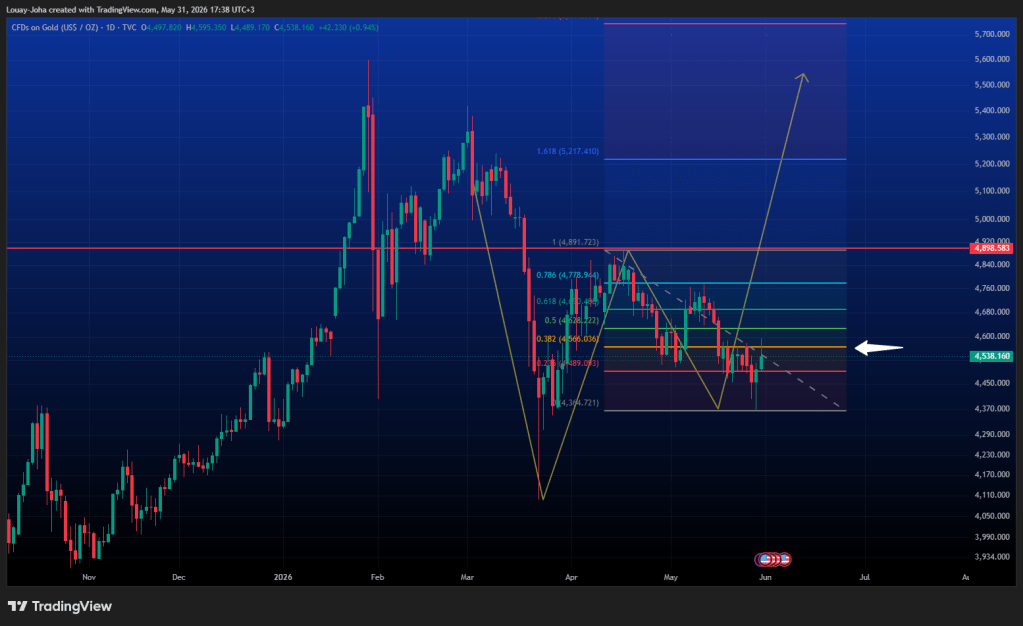
However, we can clearly see that gold failed to secure even a single daily close above $4,894, which represents a serious negative signal for prices.
If we instead use Fibonacci analysis to measure potential bearish momentum from the major low at $4,098 to the recent high (the previously assumed neckline) at $4,894 we find that the price is currently trading below the 0.382 Fibonacci level.
This suggests that buying is the wrong choice at this stage.
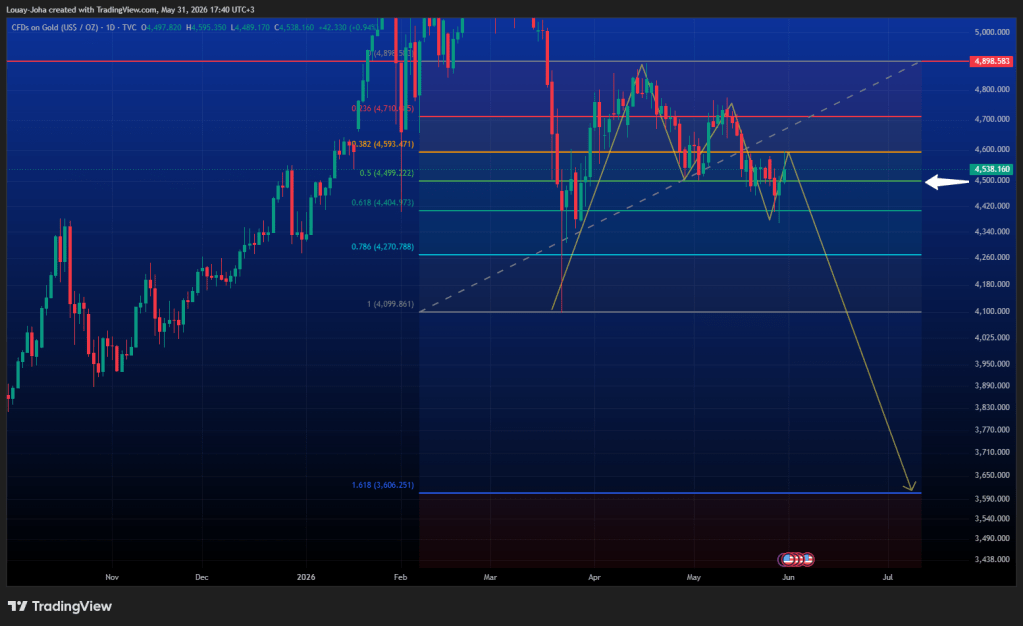
The 50% Fibonacci retracement level at $4,494 now becomes the key selling trigger.
Should the price break below $4,494, long positions should be avoided entirely. Such a breakdown would open the door to a broader bearish move that could extend toward $4,097 – $3,607 per ounce.
At the moment, gold’s main source of support remains a potential easing of geopolitical tensions surrounding the Strait of Hormuz, which could help reduce fears of higher interest rates among investors. Continued disruption in the strait would present significant economic and financial challenges for the global economy.
Ultimately, even if such declines occur, they may provide a genuine buying opportunity that many investors never expected to see after gold reached its all-time highs near $5,600 per ounce in record time.
Despite short-term fluctuations, gold remains the world’s premier safe-haven asset and the most trusted precious metal throughout history, having proven its value through every major crisis.
